

Technical Analysis has always been a polarising subject. Millions believe in it religiously and extensively deploy it in their trading and investing strategies. Charts indicate everything and fundamental news-flows do not matter in their opinion. But those on the other side take pot-shots on the logic or rationality of predicting market movements based on lines and candle sticks on charts.
Which side are you on? Through this fictional conversation between two people, let us explore the art and science of this interesting topic. By the end of it, whether it leaves you convinced or not, you will at least got a better perspective.
Hard talk
Two legendary football managers – Jose Mourinho and Pep Guardiola – although retired after an illustrious career, have not retired from the competition. Only that this time, the battlefield is not a stadium! They clash over investment philosophies at Paparazzi café, Chelsea, in the Metaverse.
As destiny would have it, both believe in different systems. Jose trusts in Technical Analysis (TA) and Pep believes Fundamental Analysis (FA) is the right way to analyse an asset.
Pep: Charts and candlesticks these days instead of football field simulators?
Jose: They give me less stress than El Clasico. No Sergio Ramos chasing the referee here.
Pep: TA looks like black magic to me. Sounds interesting, but does it work?
Jose: Trust me. Incorporating TA in your scheme of analysis can be the ‘Messi-as-False-9’ moment for you in investing. It opens up whole new possibilities without disturbing your existing methods.
Pep: It’s just lines and candles on the chart. Looks beautiful, but how do they mean anything?
Jose: They mean everything. I won’t say it is the holy grail. But it gives you reference points and boundaries to operate in. Like how you had 4-3-3 and how I stuck to 4-2-3-1.
TA is like reading the crowd at Old Trafford. One roar can change everything. Likewise, one candle or one pattern can change everything – collective psychology of the crowd.
You may be a fundamental analyst. But once you make up your mind to buy a stock, it gets added to the whole scheme of things, though it may be miniscule. Everything adds up and is shown in price. Just that you should know how to read it.
Pep: So, you are coming to the ‘assumptions’ of TA?
Jose: Indeed. I believe that price discounts everything, prices move in trend and history tends to repeat itself. So, yeah, I’m in full agreement with the assumptions.
Pep: But how do you think these assumptions can be true?
Jose: Basically, the price captures the supply and demand of an asset. If the demand is higher than supply, it can lead to a surge in price and vice-versa.
Pep: Yes. The Law of Demand and Supply. We’ve experienced that in the player transfer market.
Jose: Exactly! Every moment, thousands of market participants armed with publicly-available data, private insights, expectations and emotions are buying and selling, driving the price.
Suppose a company under analysis has some announcement, which can potentially be good for them, you might have seen the price rise before the actual release of the information.
For example, take earnings announcements. There are times when a stock starts moving up before a positive earnings announcement. This could be because some institutions, through data points they have gathered from primary and secondary research and analysis, would have gained confidence in a good earnings report and started accumulating the shares in large volumes upfront.
Pep: But buying and selling happens every second. How will you distinguish this from normal market behaviour?
Jose: Good question. The answer is volumes. If you see anything abnormal, it is highly likely that something is brewing. Smart money, usually big in volume, moves first. So, in the above example, you could have captured this data through TA.
Pep: Ah! Sometimes, even a ‘fundamentally weak’ stock can keep hitting fresh peaks. Irrational, but it can happen. How will you read the charts there?
Jose: As long as it moves up and if the momentum is strong, buy some shares and make money. It’s like Filippo Inzaghi. Offside 10 times a match, barely touches the ball, but somehow ends up with the winner. The fundamentals said no, but the scoreboard said yes.
Pep: Mind you, once the fall kicks in, it can go very deep. Even I don’t construct an attack with all 10 men on the offensive.
Jose: That’s why we have a stop-loss. Just ‘park the bus’. That way, your loss can be minimised. You can even exit with some profits if you can trail the stop-loss higher as and when the stock price moves up.
Pep: Hmm… if price is everything, do you mean the higher the stock price, the better the stock?
Jose: Absolutely not! We don’t judge a player by the scoreboard alone. How he moves, reads the game and handles pressure matters. Likewise, we don’t look at the price per se, but how it has been behaving.
Broadly, the price is seen as the net result of the expectations of all market participants and irrespective of the source of information, it keeps reflecting in the price. Not only that, charts also reflect fundamentals, irrational behaviour, speculation and herd mentality. That way, charts not only tell information about the past but also the present.
That brings us to information frequency. Fundamental-related news usually comes at very less frequency, most probably every quarter for stocks. Whereas price keeps adjusting real time.
Pep: Well, it’s fine that it reflects everything. But another assumption says the price moves in trend. How does that happen?
Jose: Just randomly open the chart of an asset and you yourself can tell whether it is in an uptrend or downtrend. Take the Indian benchmark index – Nifty 50 – for example. This is the monthly chart. In which direction has it been over the years? Up. This shows that once the trend is set, it is likely to stay that way.
Pep: But you cannot be sure that the trend will continue, right?
Jose: Of course, the direction can change. Like how Nifty 50 fell between September last year and March this year. And in early April, it started moving up.
Pep: That’s because Trump announced a pause on tariffs.
Jose: I’ll tell you something and leave it just there. See how Nifty 50 reacted on April 7. Look at that candle. It opened very low, but saw a strong intraday rally, which was clearly an above-average performance. It was just like your fullback breaking forward at the perfect time, changing the direction of play.
I see that as a positive signal. Trump hit the pause button on tariffs on April 9. So, the price action told us in advance that something was brewing. To put in John Maynard Keynes’ words, the shifts in market behaviour are ‘animal spirits’ – spontaneous urge to action rather than inaction.
Pep: By the way, what is a candle and where do indicators come in?
Jose: Simply put, a candlestick is the graphical representation of the movement a security witnessed in that time period. You can get four price points – open, high, low and close.
And for indicators, there are hundreds of them. But the commonality is that they all take prices as input. Some take volumes as well. Each indicator processes them in a different way and tells you something.
Pep: Can you tell me about the moving average? I’ve seen almost all the chartists talking about it.
Jose: As the name suggests, it’s the average numbers. The most used is the 20-period average. Suppose you plot this on a daily chart, the latest number is the average closing price of the last 20 days. If the current market price of a stock goes above this level, then it means that the stock has started giving above-average performance, a positive indication. Think of it like a striker outscoring his usual form. It grabs attention because it hints he’s heating up.
Pep: But still, you cannot be sure that the uptrend can continue.
Jose: I agree. Let me ask you this. Suppose you decide to take a wager in a match which Chelsea plays at Stamford Bridge. They have won eight out of the last 10 matches. And they have won six matches straight. Will you bet that Chelsea would lose?
Pep: No way! The momentum is with them, players will be confident and the fans will be with them since it’s their home stadium. It is very unlikely that they will lose. Even if they concede an early goal, they can bounce back.
Jose: There you are! Apply the same logic to stocks. If it has been gaining steadily, there is momentum. Even if the price drops temporarily, it can align back to the broader uptrend. And like fans will be with Chelsea, when more people start buying, the trend will only get stronger. Volumes, you see!
Pep: Makes sense. Can you show me your recent trade so that I can know more about how you put things together?
Jose: Why not? I’ve been bullish on gold since end of March 2024. Look at the gold chart. This is Monthly time-frame. You can see how gold was struggling to beat the resistance at $2,070 since August 2020. But the resistance was breached as bulls charged ahead in March 2024.
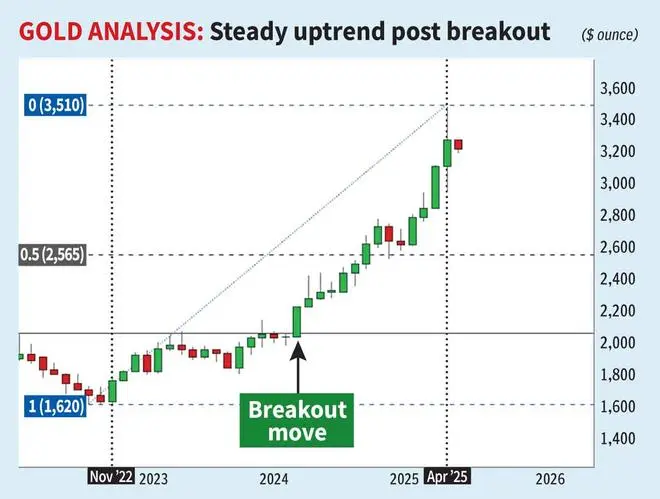
Pep: In fact, the price surged above $2,070 by mid-March. But why did you wait till the end of the month?
Jose: Because I was planning to hold the position for long term, I waited for gold to close the month above $2,070 before I pulled the trigger. Because sometimes the price can drop back below resistance before the candle closes.
Pep: So, is a close above resistance the actual breach?
Jose: What’s the use of Pirlo’s through ball if Toni or Totti doesn’t score a goal? I waited till the month-end and bought it for $2,240. And as we discussed above, you can see that after the breakout, gold established an uptrend. And volumes have been high since then. Volume is belief. It’s what the crowd believes. If a breakout comes with volume, it’s like Germany’s 7-1 win against Brazil – no fluke, just dominance.
Pep: Did you have a stop-loss?
Jose: I did. And I still do have one. You know I’ll park the bus when there is something for me to lose.
Pep: How do you go about it?
Jose: See, resistance, when broken, can turn into support, because of the shift in investor sentiment. These support and resistance levels, commonly referred to as SR levels, form because a significant volume of trade occurs around that price, leading to a change in the direction of the ongoing trend. Traders act the same way every time they reach those levels. It’s memory. Like your obsession with that Bayern Munich passing grid.
Coming back to gold, since it went past $2,070, it will henceforth be a support. So, the stop-loss I placed first was a little lower at $2,040 so that no temporary blips can trigger my stop-loss. And I keep changing this.
Right now, my stop-loss is $2,800. How? Ever since the breakout, if you see the chart, whenever gold price saw a moderation, it was arrested at 20-week moving average. This has been acting as a dynamic support. Now that this average is at $2,915 and then the price action shows that $2,850 is another support, I placed stop-loss a little lower at $2,800. I move this up as and when the 20-week moving average increases.
Pep: Suppose if the price falls from here, you will exit at $2,800. That’s still a good $560 profit per ounce from your purchase price of $2,240.
Jose: I’m more than happy with that. We know that attack wins you games, defence wins you titles. Having a stop-loss based on some logic and sticking to it can save you from many headaches.
Pep: I get it. Once you are out of this trade, you’ll look for some other opportunity?
Jose: Yes. Or I would buy gold again when the price drops to $2,565.
Pep: Why at $2,565?
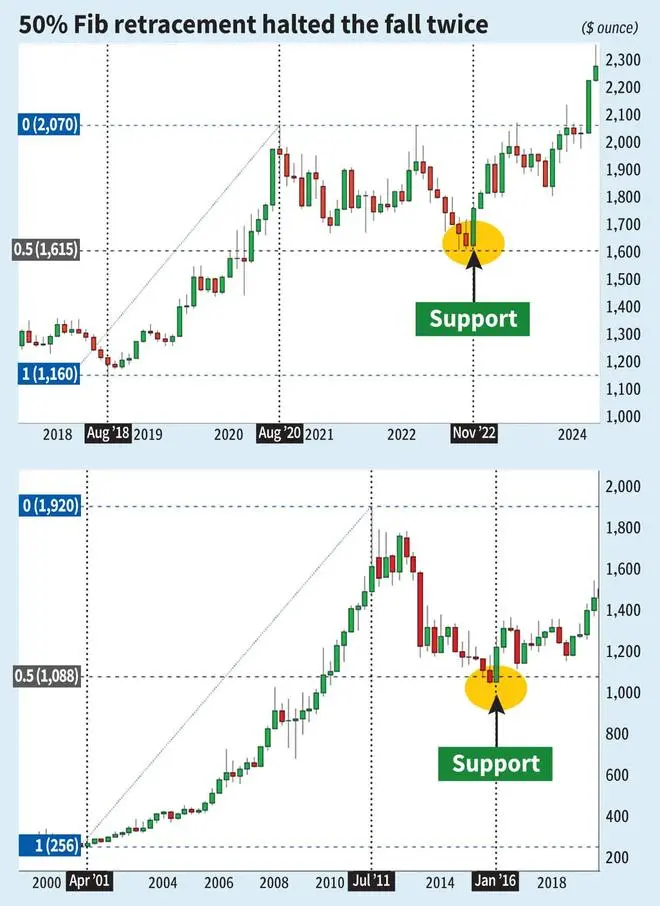
Jose: Let’s see some historical price movement. Between May 2001 and August 2011, gold had a good run-up. Following this, the price declined. But this was stopped at the 50 per cent Fibonacci retracement level of that uptrend, which fell at around $1,090.
Pep: Yes. But then the price did not move much after that.
Jose: Correct. The next uptrend happened between August 2018 and August 2020.
Pep: Why does the bull run have to end in August both times?
Jose: You already see a pattern here. Nice! You should also see this – the downtrend that followed ended at around $1,615. Again, the 50 per cent retracement of the preceding bull run. History repeating.
Pep: So, this $2,565 is the 50 per cent retracement of the rally between November 2022 and April 2025.
Jose: Now you sound like a technical analyst. So, the current bull run in gold might come to an end this August. Or it may not. We don’t know that. I will just hold the position and adjust the stop-loss and let the market do whatever it wants to do. You see, I can only sub-in Balotelli. What he does on-field is absolutely out of my hands. I only control what is in my hands.
Pep: Well. But this is not enough. Everything looks easy in hindsight. Tell me if you can spot some uptrend brewing.
Jose: Why not? Look at the Nifty Oil & Gas index. A good rally in the last two months, outperforming Nifty 50. But the catch here is, you cannot trade the index. So, you can look at the stocks that have more weight on this index.
Pep: You have any pick?
Jose: Reliance Industries. It has rebounded strongly from the 50-month moving average. Ever since the stock moved above this average in March 2014, it has not slipped below this apart from brief dips below it a couple of times. In addition, the 38.2 per cent Fibonacci retracement coincides.
With this background, last week’s crossing over of ₹1,325 is like a final confirmation to me as it made a higher high for the first time since June 2024.
Pep: You sound like it’s easy money.
Jose: Big NO. I would like to remind you this – the market is like Real Madrid in injury time; unpredictable, but always dramatic.
And remember, I cannot just ‘Knowledge Transfer’ TA to you. It needs to be experienced. Learning is one part and applying it efficiently and with discipline is another part, the most difficult part.
Take time. Read more about the tools and indicators available. Pick the ones that you think will match your personality. Put it to use. You’ll not get an efficient system right at the first attempt. Refine it, back-test it, apply it. Repeat this until you crack it.
Pep: You are turning trading into tactical warfare.
Jose: But that’s the game. You cannot control it, but only interpret and do necessary things from outside to get the favourable outcome.
Pep: Let me work on this. Meanwhile, if I lose money trying this, I’ll quote your post-match rants.
Jose: Try doing. Here’s a pro-tip from ‘The Special One’. Never risk over 2 per cent per trade and don’t be obsessed with just one system like your Tiki-Taka. If something doesn’t work, modify it. Journal your trade and study them like you study the match videos. Note down the mistakes and learn from them. To quote the legendary trader Jessie Livermore, “There is only one side of the market, and it is not the bull side or the bear side, but the right side”.
Published on May 3, 2025

